HALEY BRITTINGHAM ⍚ PORTFOLIO
QUANTITATIVE ⍚
Mathematics
Student Exemplar - 2015-16 End of Year North Carolina State Test
To the right is a slideshow of a student exemplar of the North Carolina 2015-16 Summative Assessment. This student correctly answers every single question and subsequently received a 100%. For each answer, if students correctly answered all parts of the question they received 3 points, if partially correct then 2 points, and if the answer is incorrect or blank they receive 1 point.
 |
|---|
 |
 |
 |
 |
 |
 |
 |
 |
 |
 |
 |
 |
 |
 |
 |
Official Test Website
The official and released First Grade NC Mathematics Summative Assessment can be found HERE.
Scoring Sheet
To the right is the whole class scoresheet for the end of year summative assessment. On it, you will see individual scores for each student going across horizontally under a math NC state standard. At the end of the line is their score out of the total 45 points. To the left of the chart is a breakdown of ethnicity (E); H - Hispanic, B - Black, W - White. The county and state kept records of how students were doing as whole demographic groups to pinpoint any particular patterns and academic gaps. Beside the (E) is a percentage, or overall score, for each student. Our total class average was 86%.
By the end of the year, I had 17 students compared to 20 during the middle of the year. The numbers at the bottom are the total amount of students who showed proficiency (3). These numbers are what the school math coach used for her data collection to create the "class comparison" tables and charts that can be seen at the bottom of this page.
The scoring sheet can be found HERE. This is a direct link to the official teacher administration manual which includes the rubrics for each question and the scoring sheet (at the end of the PDF) for the 2015-16 summative assessment.


Summative Assessment (EOY) 2015-16 Student Data
Formative Assessment (MOY) 2015-16 Student Data
This test focused on three main mathematical topics: numbers and operations in base ten, operations and algebraic thinking and geometry involving less complex concepts for each problem compared to the summative assessment which also included measurement and data. I used this sheet as an overall view of what I needed to go back and reteach as well as areas of strength and weakness. The MOY data was not submitted to the county and was solely for teachers to collect data on student progress. For this assessment, our total class average was 84%
Analysis - Summative Assessment
Overall, 14 out of 17 students scored a 90% or above. This information tells me that students felt confident in their abilities to tackle tricky problems. Since this test was the end of year assessment, it demonstrates that students were better equipped for second grade because they had a solid foundation of operations and algebraic thinking, number and operations in base ten, and measurement and data.
For some of the students, particularly two of them, this test was very easy for them as they would learn math concepts very quickly and I often provided them second-grade math activities for enrichment. For the majority of my class, the percentages shown in the blue box showcase that they indeed made huge gains because most of them struggled with operations and algebraic thinking and base ten problems during the middle of the year.
For the one student who received an 80, she was stronger in base ten operations and measurement and data; this makes sense as this student came in midway through the year which is when our class spent a lot of time on place value and measurement and data. She primarily struggled with thoroughly answering word problems. She would often just pick out the numbers rather than reading the question carefully to see what it was asking. Lack of understanding the question led her to miss the second part of task 1 and 3. She also received a lot of partial credits due to getting one part correct and another wrong.
For the student who received a 75, she showed a strong understanding of base ten operations and measurement and data, but the word problems were challenging for her. Although each problem was carefully read to the class, she would not go back and reread it. She would immediately start pulling out the numbers, similar to the previous student above, and would result in her getting either a two or a one.
For the student who received a 57%, this was actually a considerable growth for her as she greatly struggled all through Kindergarten and First-grade. According to her IEP, she was allowed to take the test away from the other students so she could focus and was given more time to complete it. Ms. Andrews, my instructional assistant that year, administered and read each question to her. She received a one or a two on most questions, except the last two, she earned a three on, which involved measuring a bigger bike to a smaller bike and geometry. The reason this was a dramatic academic growth for her is that this test score was much higher than the middle of year score, which was a 39%, and showed that although she did not master all of the first-grade skills, she was learning and making some growth. In particular, she improved her number and operations in base ten which of course was a foundational step for her to continue developing and learning the other concepts.

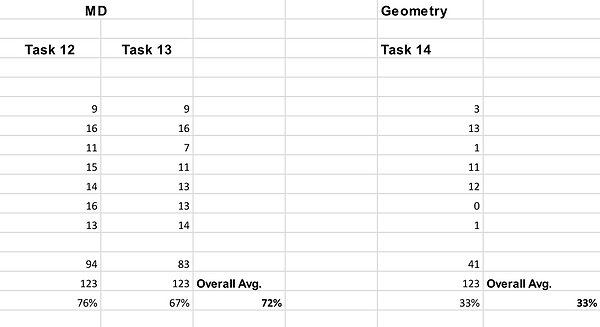
Analysis - Class Proficiency Comparisons
Each year the Math Curriculum Coach gathers the math summative data to find trends amongst grade levels and submits it to the county. Below is the trend analysis for 2015-16 first-grade classes at RHM, including mine.
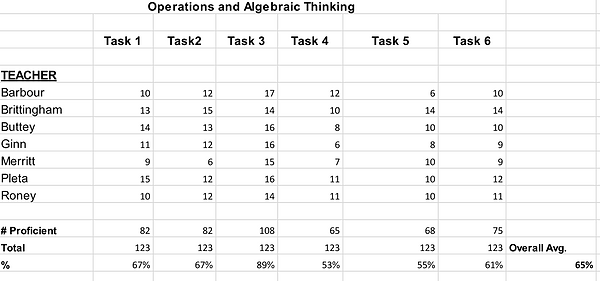
Each number represents how many kids received a full "3" points (showed proficiency) for each task.
For the first six problems, my class average scores were 76%, 88%, 82%, 58%, 82%, 82%, respectively. Task 4 was the lowest overall score for the entire test. I contribute this low score to students not being familiar with the format of how the problems were presented and the wording of "find the unknown number." Which is most likely a result of the way I presented the material initially when teaching about missing numbers.
This end of year test measured mastery of first-grade skills in preparation for second grade. I remember feeling confident that my students had a solid foundation of base ten, algebraic thinking, measurement, and data, as well as geometry. As the class percentages, 78%, 86%, 94%, and 76%, for each category show, my students mastered these skills.
Proficiency was considered 75% or higher, 16 out of 17 students scored this with most scoring between 80 and 100. One of my students was not considered "proficient" for first grade standards; however, she did make dramatic growth according to her IEP goals. Everyone, including the principal and the special education teachers, was elated for the progress she had made because her score of a 57% was the highest mathematical assessment score she had received in both kindergarten and first-grade.


52%
94%
52.5%
76%
79%
70%
76%
17%
76%
.05%
64%
70%
0%
.05%
84%
86%
60%
63%
59%
91%
72%
65%
78%
69%
60%
58%
74%
66%
Overall, this quantitative data shows dramatic academic growth with 94% of my class proficient on the EOY summative assessment with a class average of 86%.